
The Fed - Fertilizing the Rich Man's Field with the Sweat of the Poor Man's Brow
"Inflation is the surest way to fertilize the rich man's field with the sweat of the poor man's brow."
Charles Holt Carroll (also attributed to Daniel Webster)
"The Fed doesn't have any direct responsibility for these issues (wealth inequality) but nonetheless they are important." Jerome Powell, March 2020
DISCUSSION:
Over the next several weeks everything Charles Holt Carroll got right in his assessment of the damage wrought by inflation, and everything Jerome Powell got wrong in dismissing the Fed's role in causing wealth inequality will be discussed. It will also be shown that the Fed's leading role in the concentration of wealth is merely a by product of the enormous inflation the Fed has created since it was freed from the constraints imposed on it by the Bretton Woods agreement of 1944. This agreement made the dollar the world's international reserve currency and valued the dollar at $35 per ounce of gold. (gold now trades around $1700 per ounce) Per this agreement, any national central bank could present $35 to the Federal Reserve and exchange the currency for one-ounce of gold. (individuals couldn't do this)
Before diving into the data, the term 'inflation' has to be defined. One of the biggest victories achieved by modern economists and modern central bankers is changing the definition of inflation. Inflation used to mean an increase in the money supply - full stop. For the most part, it was accepted that it wasn't always possible to know what prices would increase as a result of the money supply increasing first. At times, consumer prices might increase, but consumer prices could also remain constant while asset prices soared. Indeed, one of the leading causes of the Great Depression was the stable consumer prices of the era blinded people to the enormous asset bubble the Fed was blowing up. (1) For the purpose of this discussion, the classical - and best - definition of inflation, which is only concerned with the money supply, will be used.
Defining inflation in terms of its impact on money supply is crucial to understanding everything the Fed has gotten wrong over the past several decades. By defining inflation in terms of the money supply - something the Fed has great control over - it then becomes much easier to identify the impact of Fed policies on the overall economy. As the great Jim Grant, of Grant's Interest Rate Observer, wryly observed;
What inflation is not, we believe, is 'too many dollars chasing too few goods.' Pure and simple, it is 'too many dollars.' What the redundant dollars chase is unpredictable. In recent months they have chased stocks, commodities, euros, junk bonds, emerging market debt and houses. On Wall Street, such inflationary episodes take the name 'bull markets.' They are always welcome. When, on the other hand, the surplus dollars chase skirts (or sweaters, or automobiles, or medical care), that phenomenon is called 'inflation.' It is usually unwelcome." (2)
As will be shown, since 1971 the Fed's monetary profligacy (inflation) has produced two effects;
- Enormous increases in consumer prices (food and energy will be discussed here)
- Enormous increases in asset prices (Manhattan real estate will be discussed next week)
At times, these effects appeared simultaneously. However, for the purposes of the discussion here, the impact of Fed policies on asset prices will be confined to the time period after Alan Greenspan's 'irrational exuberance' speech in December 1996. In this speech, Greenspan cautioned against asset prices getting ahead of themselves and cited Japan as a prime example of what could wrong. While Greenspan was correct, the market reacted negatively to the speech and Greenspan was more interested in being popular than being correct. Soon after this speech, Greenspan became one of the biggest cheerleaders and enablers of the tech stock bubble.
EFFECT #1 - Enormous Increases in Consumer Prices (post 15 AUG 1971)
Figures 1-3 are based on data provided by the St. Louis Fed. (See Endnotes 3-5). Figure 1 (electricity), Figure 2 (food) and Figure 3 (energy, food and fruits/vegetables) all show prices remaining remarkably stable for decades on end. However - and not coincidentally - this era of stable prices ended with the end of the Bretton Woods agreement, August 1971.In the words of Wilhelm Ropke;
"If in the production of goods the most important pedal is the accelerator, in the production of money it is the brake. To insure that this brake works automatically and independently of the whims of government and the pressure of parties and groups seeking "easy money" has been one of the main functions of the gold standard. That the liberal should prefer the automatic brake of gold to the whims of government in its role of managed trustee as a managed currency is understandable."
Freed from the constraint of having to provide gold on demand, the Federal Reserve simply created too much money, 'redundant dollars' as Jim Grant would call them. These redundant dollars then chased all types of goods, including the two most important goods consumers purchase - food and energy. As these figures clearly show, prices for food and energy soared in the aftermath of August 1971, and continued to soar for decades.
FIGURE 1
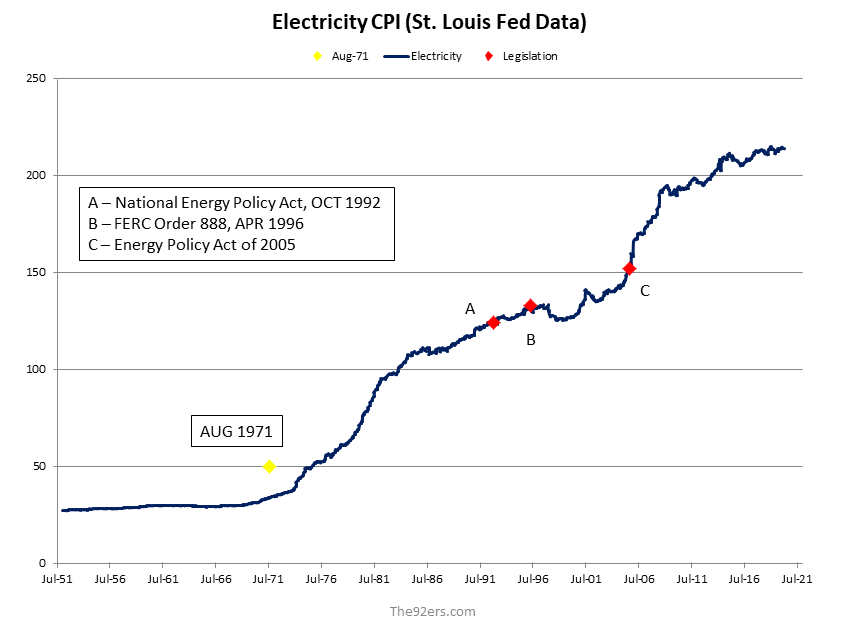
FIGURE 2
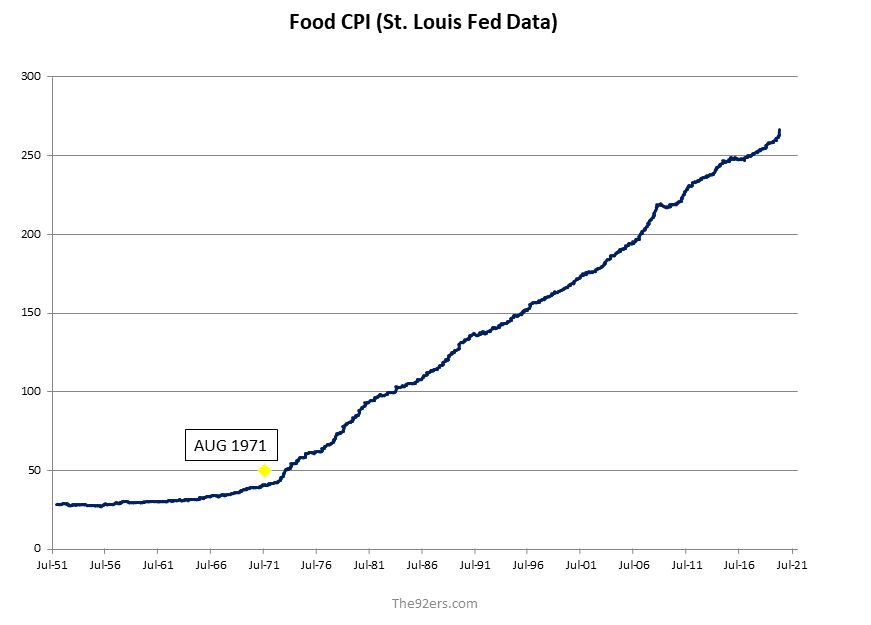
FIGURE 3
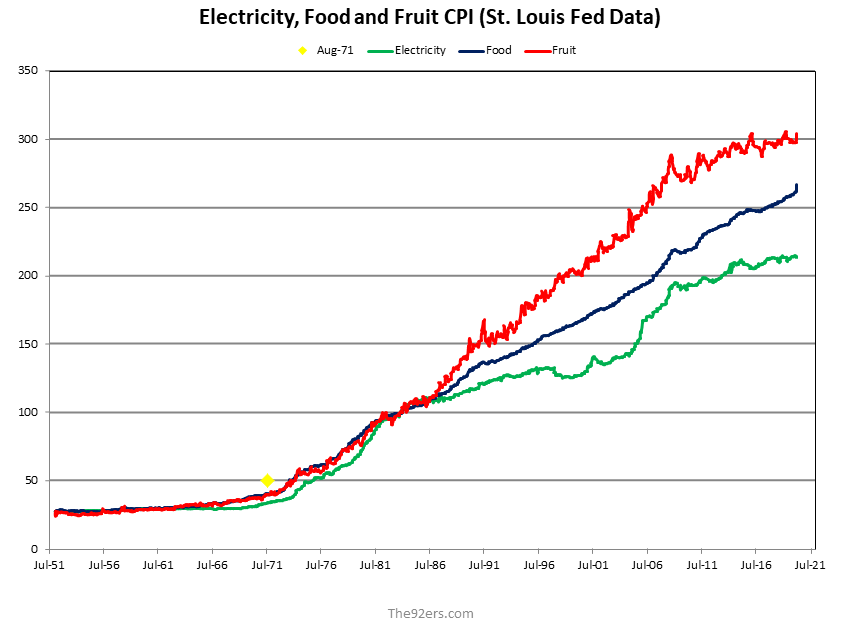
Note: Unlike the prices of food (Figure 2) and fruits/vegetables (included in Figure 3), the price of electricity (Figure 1) did not uniformly increase in the years after August 1971. As one can imagine, there are doubtless many factors that played a role in this price behavior. Figure 1 identifies three government actions that appear to have played a role in this price behavior. These actions are;
- (A) National Energy Policy - a major step in the deregulation of electricity supply
- (B) FERC Order 888 - required utilities to provide access to the electricity grid to independent power producers, thus further opening up electricity to competition and lower prices
- (C) Energy Policy Act of 2005 - provided incentives for renewable energy
This is brought up not to begin a debate on energy policy, but to highlight the fact that prices for a particular good can fluctuate for any number of reasons. However, when prices for all goods rise at once, then - outside of a military siege or catastrophic natural disaster - the cause is monetary in nature.
CLOSING REMARK & PREVIEW
These figures tell an incredibly grim tale and speak volumes of the disastrous job the Fed has done since August 1971. One of the Fed's mandates is 'stable prices.' As these figures make clear, prices have been anything but stable. While this data shows the enormous increases in consumer prices produced by the Fed's inflationary policies after August 1971, it doesn't provide any insight into how inflation of this type would produce the unprecedented concentration of wealth that defines today's US economy. Exactly how the Fed's post-1971 policies contributed to this concentration of wealth will be discussed in next week's article.
Peter Schmidt
Sugar Land, TX
June 07, 2020
PS - As always, if you like what you read, please register with the site. It just takes an e-mail address and I don't share this e-mail address with anyone. The more people who register with the site, the better case I can make to a publisher to press on with publishing my book. Registering with the site will give you access to the entire Confederacy of Dunces list as well as the financial crisis timeline.
Help spread the word to anyone you know who might be interested in the site or my Twitter account. I can be found on Twitter @The92ers
ENDNOTES:
1. "The Errors of the Stabilationists are Identical to the Errors of Today's Central Bankers," The92ers.com, July 27, 2019 http://www.the92ers.com/blog/errors-stabilationists-are-identical-errors-todays-central-bankers
2. James Grant, Mr. Market Miscalculates - The Bubble Years and Beyond, Axios Press, Mt. Jackson, VA, 2008, p. 107
3. Electricity Data: https://fred.stlouisfed.org/series/CUSR0000SEHF01
4. Food Data: https://fred.stlouisfed.org/series/CPIUFDNS
5. Fruits and Vegetables: https://fred.stlouisfed.org/series/CUSR0000SAF113