
California Dreaming: Renewable Energy and Which States are Doing Best
In last week's blog post, we discussed the virtue signaling latent in Microsoft's declaration that it would soon be not only carbon neutral, but carbon negative. Microsoft's entire reason for existing is computers and computers inhale electricity. For Microsoft then to make much of its carbon neutrality when it is in an industry that completely relies on prodigious amounts of electricity generation is transparently bogus and self-serving.
We see the same same self-serving, sanctimonious self-righteousness in individual states that we see from Microsoft. The prime example of this self-righteousness comes, of course, from California. California routinely trumpets its progress on renewable energy, but the manner in which California judges its progress is just as meaningless as Microsoft's. California judges its progress against the power that is produced in California, not the power California uses. (California imports huge volumes of electricity from dams in Oregon and Washington, and nuclear plants in Arizona, Palo Verde in particular). Moreover, California has been deindustrialized. Energy intensive products like aluminum or steel - which are used throughout California - have to be made elsewhere.
Because California is such a large importer of electricity and because California has been de-industrialized, California's boasting about the renewable energy it generates requires additional inspection to discern just how meaningful this figure is. This inspection will clearly show that California has very little to brag about. In fact, California's progress on renewable energy generation, wind and solar, only mirrors the average progress that is being made in the US as a whole!
Chart 1 provides the most recent data for US electricity generation. Specifically, Chart 1 shows not only how much electricity was generated for the years 2005 - 2018, it identifies how this electricity was generated. This is a very dense chart with a tremendous amount of data, all which also comes from the Energy Information Administration, (1). Renewable energy generation, wind and solar, comprise just over 10% of total electricity generation. (Wind is in 'other renewables.')
CHART 1
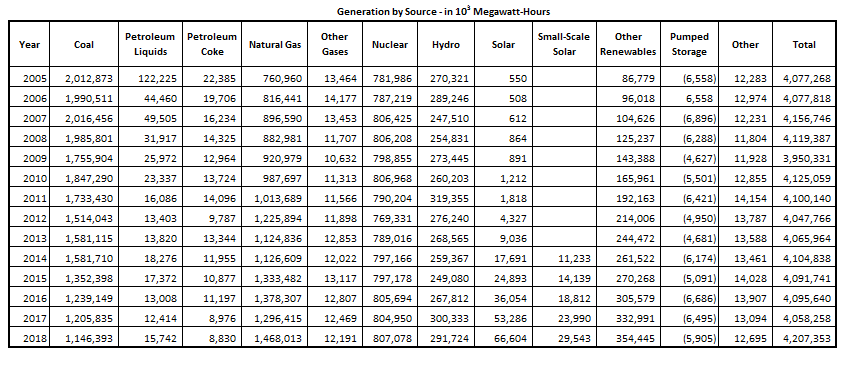
Chart 1 allows us to determine the total per capita per hour electricity consumption in the US. Because the numbers associated with electrical energy generation are so large, per capita figures are often much easier to work with. In addition, per capita figures also provide some context to what would otherwise be just numbers with no physical meaning. Total US per capita per hour consumption of electrical power is taken from total US energy consumption, 4,207,353 x 103 MW-hours, and dividing this figure by the US population (~320-million) and the number of hours in a year (8,760).
So, what is the per capita per hour consumption in the US? 1500-watts (1.5-kw). This means that for every person in the US, 1.5-kw of electrical power is being consumed every hour of every day!
Chart 2 below shows the total renewable energy generation on a state by state basis. (Renewables here are wind and solar) (2) States are ranked on their per capita production of renewable energy. Each states' per capita production figure can then be compared to the US' per capita consumption figure, 1.5-kilowatts, (or 1500-watts), to provide further nuance to how well individual states are doing.
What the data shows is that it is almost exclusively 'Red" states that are generating the most renewable energy. The per capita generation figures in particular show the progress that is being made relative to the 'bluest' blue states like California, New York and Massachusetts. In fact, of the top ten states based on per capita production of renewable energy, all but two are among the 'reddest' Red states. (Kansas voted for Alf Landon against FDR in 1936!)
CHART 2:
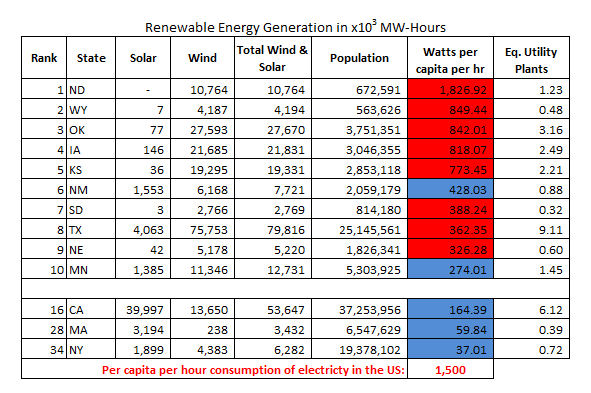
I want to highlight some additional inferences from this data;
- The number of 'Eq. Utility Plants' converts the renewable energy into the number of equivalent 1000-MW power plants.
- Texas produces more renewable energy than California, New York and Massachusetts combined
- California, with ten times the population of Oklahoma, only generates twice as much renewable energy as Oklahoma
- Massachusetts, with a population over twice as large as Kansas, generates only 20% of the renewable energy Kansas does
- When judged against the average per capita per hour consumption of electricity in the US, 1500-watts, California only produces 11% of its energy with renewables.
- Judged on a per capita basis, California's progress with renewables is only slightly better than the country as a whole and not evenly remotely close to the state's much ballyhooed goal of 50% renewable power by 2025 and 60% by 2030. (3)
The brief analysis here should show how virtually devoid of any real meaning California's reported progress on renewable energy is. California's progress relies on the fact California imports huge volumes of electricity from neighboring states and had been denuded of the heavy industry that relies on large electricity consumption. (Californians still use aluminum, steel, fertilizer and petrochemicals, they just don't make any!) Keep this analysis in mind the next time someone says the country needs to do a better job of duplicating California's progress on renewables (wind and solar). In response, tell them that California first needs to catch up with North Dakota, Oklahoma and Texas!
Peter Schmidt
Sugar Land, TX
January 26, 2020
PS - As always, if you like what you read, please register with the site. It just takes an e-mail address and I don't share this e-mail address with anyone. The more people who register with the site, the better case I can make to a publisher to press on with publishing my book. Registering with the site will give you access to the entire Confederacy of Dunces list as well as the financial crisis timeline.
Help spread the word to anyone you know who might be interested in the site or my Twitter account. I can be found on Twitter @The92ers
ENDNOTES:
(1) Energy Generation Data is from the Energy Information Administration, EIA. The link here provides data for the years 2007-2017. https://www.eia.gov/electricity/annual/html/epa_03_01_a.html
(2) Data can again be found from the US Energy Information Administration (EIA).
https://www.eia.gov/electricity/data/browser/#/topic/0?agg=1,0,2&fuel=0004&geo=qnifi05c03j78&sec=o3g&freq=A&start=2001&end=2018&ctype=linechart<ype=pin&rtyp
3. "California Sets Goal of 100% Clean Electric Power by 2045," https://www.npr.org/2018/09/10/646373423/california-sets-goal-of-100-percent-renewable-electric-power-by-2045