
Electricity - Do our leaders lie to us or are they just stupid?
SUMMARY:
The political rhetoric that surrounds the promise of wind and solar electricity is completely removed from the enormous challenge of a carbon free grid. Among the numerous liberties renewable power advocates take with reality are the following;
- 'Carbon free' electricity generation is not keeping pace with the increases in wind and solar electricity generation. In fact, in 2021, the percentage of electricity generated with carbon free sources fell! (Figure 1 and Figure 2).
- The slow growth in carbon free electricity generation observed thus far doesn't even account for the huge growth in electricity generation that must accompany widespread adoption of electric vehicles.
- As more renewable energy is placed onto the grid, other generating resources have to move their production up and down. Because of this - as well as low natural gas prices - large numbers of nuclear plants have started to close. (Nuclear power is the largest source of carbon free electricity in the US.) (Figure 3)
- Wind is, far and away, the largest source of renewable energy. Unfortunately, wind power is most abundant when power demand is low. As more wind power is added to the grid, more 'redundant' generating assets are needed to compensate for the wind power that isn't available when demand is high. (Figure 4)
DISCUSSION:
On April 22, 2021, President Biden released a statement where he established a goal of "100% carbon pollution -free electricity by 2035." (1) This statement makes clear that even when it comes to incredibly important issues - and there is hardly an issue more important to a modern society than the supply of electricity - politicians are either lying to their citizens or woefully ignorant of the facts. On the topic of '100% carbon pollution-free electricity' by 2035, this can be easily demonstrated with a mere handful of charts and data.
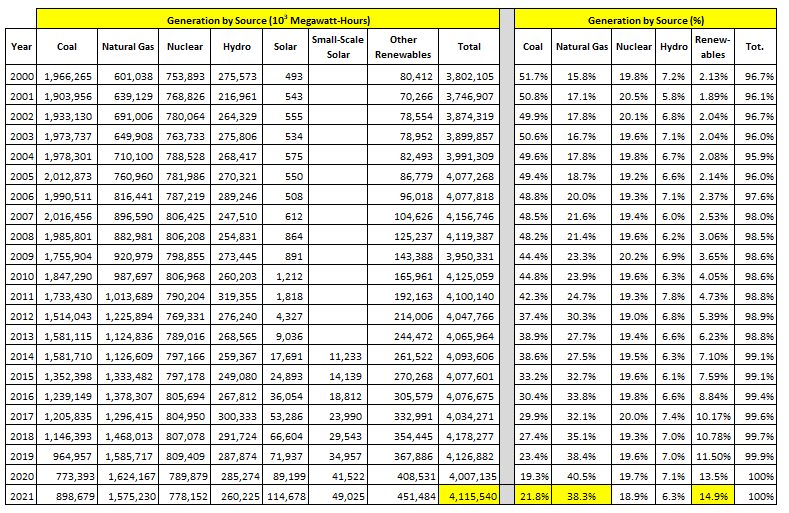
Figure 1 - which charts data collected by the US Energy Information Administration (2) - shows how the United States generates its electricity. As the data make clear, over the past twenty-one years, there have been very large changes in how the US generates its electricity. The largest changes involve coal and natural gas. Coal has gone from being the source of 51.7% of US electricity to just 21.8%. At the same time, the use of natural gas has soared. It's gone from being the source of 15.8% of US electricity to now being the largest source of US electricity, 38.3%. The other significant change has been the rise of 'renewable' sources of electricity; here described as wind and solar. They've gone from being just 2.1% of electricity generation to 14.9%. When President Biden set a target of a 'carbon-pollution free grid' by 2035, its wind and solar that will have to get us there.
FIGURE 1: US Electricity Generation by Source (2000 - 2021)
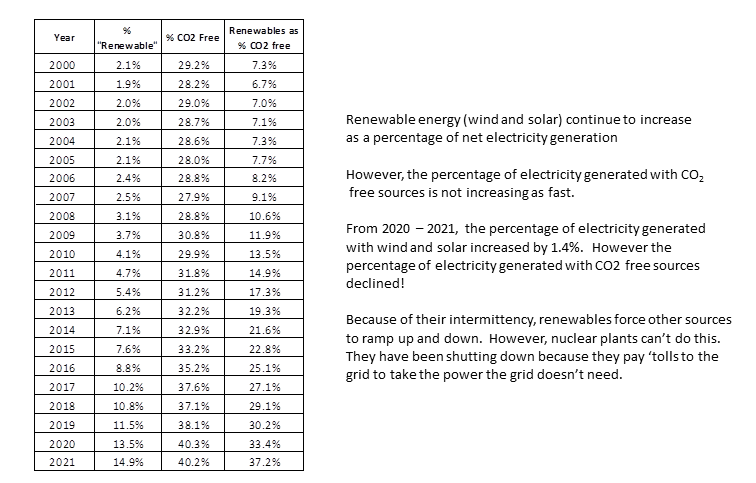
So, the question is, are wind and solar up to the task of producing a carbon pollution free grid by 2035? Not by a long-shot, and Figure 2 makes this clear. The large growth in wind and solar generation notwithstanding, nuclear power remains the largest source of carbon-free electricity in the US. (It was 18.9% of generation in 2021). In addition to nuclear, hydroelectric power remains a significant source of CO2 free energy. Figure 2 charts three values;
- the percentage of electricity generated with 'renewable' sources (wind and solar)
- the total percentage of electricity generated with CO2 free sources (wind, solar, nuclear and hydro)
- the percentage of CO2 free electricity that is generated by wind and solar
As shown in Figure 2, the absolute contribution of wind and solar to electricity generation steadily increases as does the percentage of CO2 free electricity that comes from wind and solar. Where the renewable energy train jumps the track is the absolute percentage of CO2 free electricity, the column labeled '% CO2 Free.' Gains here are not keeping pace with the gains made by wind and solar. The reason for this can be seen by referring back to Figure 1. Note that the output of the other sources of CO2 free energy - nuclear and hydro - are falling! As a result, the large increases in wind and solar notwithstanding, the percentage of electricity generated form CO2 free sources is treading water and decreased during President Biden's first year in office!
Finally, it is important to realize that the generation data through 2021 has not had to account for the widespread adoption of electrical vehicles - which will require huge increases in electricity generation! As bad as the Figure 2 data looks regarding the goal of a carbon free grid by 2035, it will look much worse as electricity generation is forced to increase as more electric vehicles are placed into service.
FIGURE 2: Progress Toward a 'Carbon Pollution-Free Electricity
In the same way there is a disconnect between electric vehicles and a carbon free grid by 2035, Figure 3 provides evidence of another disconnect. As more and more renewable power is placed onto the grid, the remaining generating sources must ramp their production up and down to meet the intermittency of renewables. For coal and natural gas plants, this is easily done. However, nuclear plants - at least in the US - don't have this flexibility. Because of their inability to ramp production up and own, nuclear plants often have to pay the grid to take the power they are generating but is not needed. As a result of this - along with cheap natural gas - large numbers of nuclear plants are unprofitable and have been shut down by their owners. Several others were scheduled to close but were saved by state legislatures that authorized subsidies to keep their nuclear plants open.
FIGURE 3: Nuclear Plant Closings
![]()
As shown in Figure 4, not only are wind and solar intermittent - which undermines the largest source of CO2 free energy - they also tend to be available when they are least needed! Figure 4 plots generation data from the Electric Reliability Council of Texas (ERCOT) for two days; a cool day in March and a stifling hot day in June. Look what happens with wind driven electricity between these two days. In the spring, when electricity demand is low, wind production soars and almost 55% of Texas' electricity needs were met by wind power! However, when temperatures soar, wind driven electricity production plummets while electricity demand skyrockets.
The rest of the grid - primarily coal and natural gas fueled power plants - is forced to greatly increase electricity generation to compensate for the large decrease in wind driven electricity. (Combined-cycle plants are fueled by natural gas) As a practical matter, the fact that huge amounts of wind driven electricity are not available when they are most needed leads to a large amount of redundant power generation equipment and capacity. In the 'carbon pollution free grid' promised to us by 2035, this fossil fuel powered electricity won't be available and there will be nothing to mask the large inefficiencies of renewable sources of electricity.
FIGURE 4: Renewable Energy - There When You Don't Need It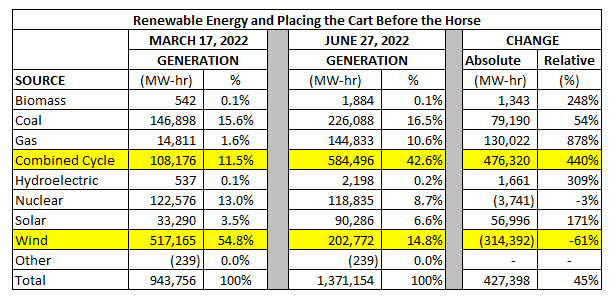
CONCLUDING REMARKS:
I'm a mechanical engineer and I have nothing against the adoption of renewable technologies. However, the adoption of renewable energy should be based on facts and what can be achieved, not empty promises with no basis in reality. In this regard, the adoption of automobiles provides a useful template. Gottfried Daimler and Karl Maybach invented the automobile around 1890. Even in the United States - which adopted automobiles at a much faster rate than even Europe - it took many decades for automobiles to supplant the humble horse as the prime mode of transportation. Indeed, when Standard Oil was broken up in 1911, its #1 product was kerosene for lamps, not gasoline for cars! (The oil business put the whaling business out of business!) It stands to reason - and the data reviewed here supports this conclusion - that the widespread of adoption of renewable power will require a multi-decade process, regardless of what even the president might promise.
Peter Schmidt
Sugar Land, TX
July 17, 2022
P.S. - As always, if you like what you read, please consider registering with the site. It just takes an e-mail address, and I don't share this e-mail address with anyone. The more people who register with the site, the better case I can make to a publisher to press on with publishing my book! Registering with the site will give you access to the entire Confederacy of Dunces list as well as the Financial Crisis timeline. Both of these are a treasure trove of information on the financial crisis and the long-running problems that led to it.
2. Electric Power Monthly - U.S. Energy Information Administration (EIA)
3. See the Fuel Mix Report for 2022
Generation (ercot.com)