Computers & Economists - A Disastrous Combination; Part II of II: When Engineers Act Like Economists
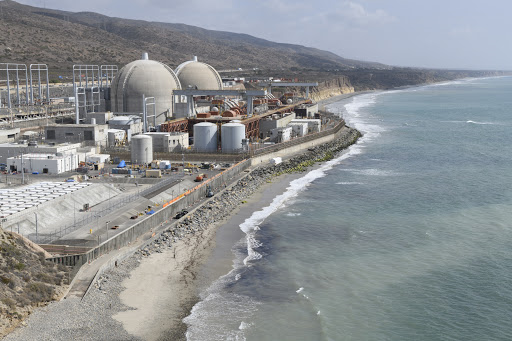
The San Onofre Nuclear Generator Station (SONGS) was a nuclear power plant located between San Diego and Los Angeles in San Clemente, California. The plant actually sits on Camp Pendleton, and anyone driving between Los Angeles and San Diego on I-5 would drive right by the plant. See Figure 1. Unit 1 operated from 1968-1992. Unit 2 and Unit 3 were placed into operation in 1983 and 1984 respectively. This article describes the pitfalls that can result from engineers using computers as economists do. More specifically, it describes how what should have been a fairly straightforward task - replacing the San Onofre steam generators - became an enormous problem that resulted in 2200-MW of power production being lost.
Figure 1: San Onofre Nuclear Power Plant (containment structures clearly visible)
San Onofre Units 2 and 3 were pressurized-water reactors (PWR). In a PWR there are two cooling circuits. A primary cooling circuit which passes through the reactor and which could be contaminated with nuclear material, and a secondary cooling circuit which doesn't directly interface with the reactor at all. See Figure 2. The primary cooling circuit passes water through the reactor and the water is heated up to about 600-deg F. The water is able to remain water because the primary cooling circuit is pressurized to a pressure of 2200-psi by the pressurizer. The water in the primary cooling circuit - red in Figure 2 - flows to the steam generator, where it then flows through tubes arranged in enormous 'U-tube' bends. The steam generators at San Onofre featured 9700 3/4-in diameter U-shaped tubes.
Figure 2:
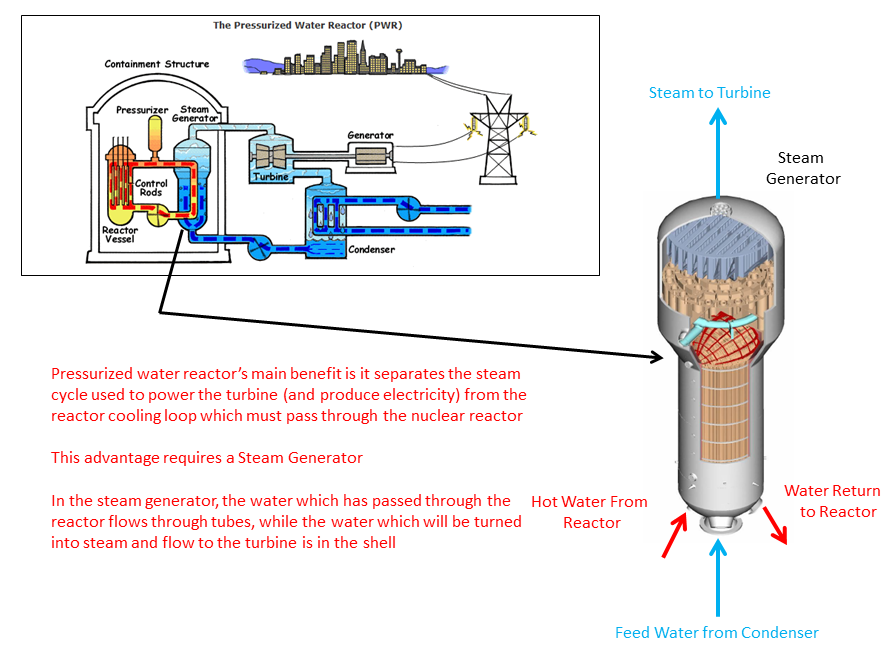
Also flowing through the steam generator is the 'feedwater' which comprises the secondary cooling circuit. The feedwater flows through the 'shell side' of the steam generator. In the steam generator, the hot water from the primary cooling circuit heats up the feedwater in the secondary cooling circuit. However, because the hot water from the primary circuit remains in tubes, the primary and secondary cooling circuits remain separated or 'isolated' from each other. The shell-side fluid in the steam generator changes from water to steam. From the steam generator, steam at approximately 1000-psig and 550-deg F is sent to a stream turbine where it is converted into electricity. Again see Figure 2.
The isolation between the primary and secondary cooling circuits is the principle advantage of a PWR design. (1) A PWR is the reactor of choice for use in submarines and aircraft carriers. Most of the nuclear power plants in the US utilize a PWR design. However, as with any technology there are always plusses and minuses, and the 'isolation' in the PWR design requires the steam generators. Steam generators are enormous; full of water they can easily weigh more than 1-million pounds and can stand 60-feet tall. The tube-side of the steam generator has to withstand pressures above 2200-psi while the 'shell-side' must withstand pressures above 1000-psi. Over time, steam generators will degrade and have to be replaced. Replacing a steam generator requires breaching the reactor containment structure (2); the two large spherical objects in Figure 1. The process can easily take 6-8 months to complete and will cost hundreds of millions of dollars. Fortunately, this replacement only needs to be done once every 25-years or so.
The San Onofre steam generators were replaced from September 2009 trough April 2010 (Unit 2) and October 2010 through February 2011 (Unit 3). As part of the steam generator replacement it was decided to change the material of construction of the tubes used to carry the hot water in the primary cooling circuit. The original material was Inconel 600, while the replacement steam generators (RSGs) would use Inconel 690. (3) While Inconel 690 was a better material to use for a number of reasons, it had a lower thermal conductivity than Inconel 600. As a result, to maintain electricity generation - roughly 1100-MW per reactor - more tubes would have to be put in the replacement steam generators. As a result, the existing steam generator design couldn't simply be duplicated. (To put some perspective on the 1100-MW reactor output, to replace the electricity produced by Units 2 and 3 over their 26-year operating lives would have required burning 138-million tons of coal - roughly the total annual output of Pennsylvania and West Virginia! (4))
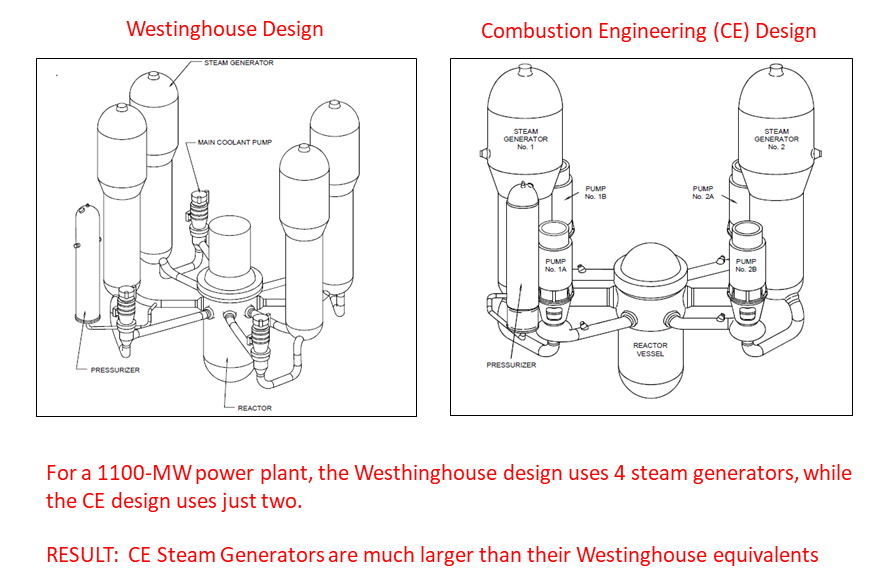
To further complicate things, the design firm selected to design the replacement steam generators did not have a lot of experience with the very large steam generators used at San Onofre. This firm's experience was with Westinghouse reactor designs, and these designs are different from the Combustion Engineering (CE) designs used at San Onofre. For the 1100-MW reactors used at San Onofre, a Westinghouse plant would have required four steam generators, while the CE design only required two. See Figure 3. The CE steam generators were much larger than their Westinghouse counterparts, and this size difference meant that some of the design 'rules' used with a Westinghouse design may not work with a CE design.
Figure 3:
In designing the replacement San Onofre steam generators, the design firm relied on computer codes developed for the smaller Westinghouse designs. Not only was their a large size difference between the two steam generator designs, different methods were used to support the tubes and prevent them from vibrating against each other. The software used to design the San Onofre steam generators did not account for these and other differences. Shortly after being placed in service, the new steam generators began to leak between the primary and secondary cooling circuits. This is a very serious issue and undermines the biggest advantage of a PWR design. Because the primary circuit operates at a much higher pressure than the secondary circuit - 2200-psig versus 1000-psig - radioactive material leaks from the primary cooling circuit into what should be the 'clean,' secondary cooling circuit; again see Figure 2. In January 2012, both Units 2 and 3 were shutdown until the source of the leaks could be determined.
What was happening? Essentially, the computer modeling used to design the replacement steam generators did not accurately describe or predict what would happen in the replacement steam generators. Rather than 'benchmarking' their design - generated as it was with their proprietary computer code - against other steam generator designs, the design firm pressed on with little more than the result of their computer analysis as a basis. Unfortunately, much more steam was being generated in the upper portion of the steam generator; the location of the the 'U' portion of the 'U-tube' bends. The steam generator requires some water to be in this portion of the tube bundle to dampen the vibration of the tubes and limit the tubes rubbing against each other. Because so much less water was in this portion of the steam generator, tubes violently rubbed against each other - recall 9700 U-shaped tubes are fit inside the steam generator - and leaks developed soon after.
Southern California Edison, SCE, the plant operator, considered running the plant at reduced power. The thought was this would reduce the tube vibration, but the Nuclear Regulatory Commission (NRC) wouldn't allow this without a lengthy licensing process. Eventually, on June 7, 2013, SCE announced they would permanently retire Units 2 and 3. Just like that, 2200-MW of electricity generation vanished from California. Instead of operating for 25-years or more, the replacement steam generators operated for less than two.
Concluding Remarks:
SCE sued the design firm for $7.5-billion with the damage amount based on the lost output from the plant over the next twenty-years. An arbitration panel ruled against SCE and the design firm's liability was limited to what had been described in the contract; roughly $125-million. To add insult to SCE's injury, roughly half of the arbitration panel's award was returned to the design firm to pay for the legal fees associated with the 7.5-billion lawsuit. Ouch! From a purely technical standpoint, engineers poured through the details of the computer codes at issue and all sorts of other design decisions associated with the steam generator replacement project. While the over-reliance on computers at San Onofre duplicated the experience of economists and Wall Street, the postmortem inspections and root cause analysis (RCA) at San Onofre stand in stark contrast to the failure of either Ivy League economists or Wall Street to revisit their mistakes.
Indeed, of the three examples of the misapplication of computers by Wall Street and economists discussed last week - LTCM, the net capital rule and the AIG debacle - none of these prompted any sort of soul-searching on the part of either the perpetrators of these blunders or the regulators purportedly responsible for keeping these sorts of things from happening. For example;
- LTCM - Lawrence Summers testified against regulating derivatives in July 1998 and never changed his mind. When he prepared the government's official position on derivatives, November 1999, he barely mentioned LTCM.
- The Net Capital Rule - after playing an enormous role in the collapse of Bear and Lehman as well as the near-death experience of Merrill, the changes to the net capital rule from 2004 remain largely in place today.
- AIG - the primary architect of AIG's trades - Gary Gorton - left Wharton and moved, with considerable fanfare, to the Yale School of Management. He wrote a book on the financial crisis - Slapped by the Invisible Hand - where he dismisses the crisis as little more than a classic bank run and barely mentions his role at AIG.
No one associated with the steam generator replacement at San Onofre covered themselves with glory. However, because of how everything that went wrong was studied, reviewed and documented, there is very little chance that these mistakes will be repeated. In contrast, the manner in which the financial community responded - or didn't respond - to the LTCM, net capital rule and AIG debacles conclusively demonstrates why we keep suffering from the same sort of economic calamities, often in rapid succession.
Peter Schmidt
October 12, 2020
Sugar Land, TX
P.S. - As always, if you like what you read, please consider registering with the site. It just takes an e-mail address, and I don't share this e-mail address with anyone. The more people who register with the site, the better case I can make to a publisher to press on with publishing my book! Registering with the site will give you access to the entire Confederacy of Dunces list as well as the Financial Crisis timeline. Both of these are a treasure trove of information on the financial crisis and the long-running problems that led to it.
Help spread the word to anyone you know who might be interested in the site or my Twitter account. I can be found on Twitter @The92ers
Endnotes:
1. In a boiling water reactor (BWR), the liquid that is turned into steam and sent to the steam turbine to generate electricity passes through the nuclear reactor. These design don't include a steam generator.
2. The containment structure contains the nuclear material. See Figure 2 and note that the reactor, pressurizer and steam generator are all contained in the containment structure. One of the reasons the Chernobyl disaster was so bad was the Chernobyl reactor did not include a containment structure. The other reason there was such a large release of radiation was Chenobyl used graphite, not water, as a neutron moderator. This allowed the Chernobyl reactor to 'runaway' or spiral out of control.
3. 'Inconel' refers to a family of nickel based 'super-alloys' and the 690 material has better resistance to primary-water stress-corrosion cracking (PWSCC) than Inconel 600. PWSCC had been seen with other pressurized water reactors and the steam generator replacement provided an opportunity to upgrade the tube material.
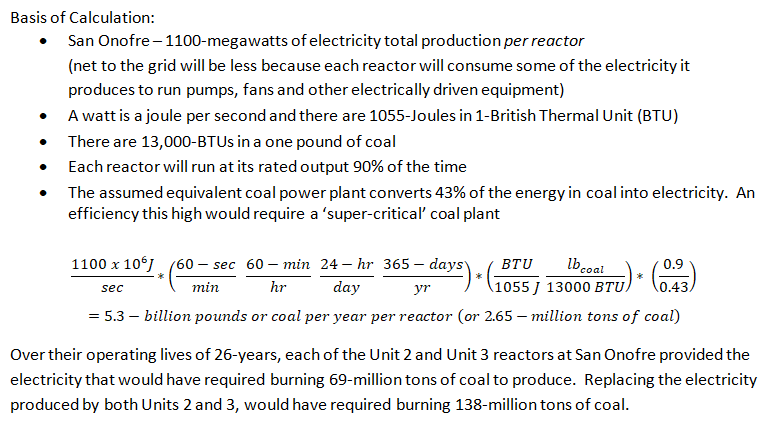
4.. Below is a brief analysis of the amount of electricity produced by each of the two San Onofre reactors and how much coal it would have taken to produce this electricity.