
Electricity, Housing and the Best Laid (Central) Plans of Mice and Men
WORDS of WISDOM: (regularly ignored by the Powers That Be)
"The substitution of government policy in credit matters for the free exercise of banking judgment is one of the most dangerous things that can come to a country." Benjamin Anderson
"The assets assigned the lowest risk, for which capital requirements were therefore low or non-existent, were those that had the most political support; sovereign credits and home mortgages." Paul Volcker
SUMMARY:
- A free market distributes resources based on the signals produced by profits and prices.
- Central planning distributes resources based on the thoughts of a handful of people.
- The enormous importance of the electricity generating industry notwithstanding, it has been subjected to central planning in the interest of defending against 'climate change;' (nee' global warning)
- However, as a result of the central planner's focus on increasing renewable energy, CO2 production may have bottomed and may now start to increase.
- This result - a consequence of the 'intermittency' of renewable energy resources forcing nuclear plants to shut down - shows the perils of central planning.
- Unless things change, the central planner's objectives of reducing CO2 from electricity generation will prove as successful as Bill Clinton's plan to increase homeownership to 67.5%.
DISCUSSION:
Table 1 shows how much electricity was generated in the US for the years 2000 - 2019, and how this electricity was generated. There is a lot of data in this chart and some perspective on these numbers is required. The electricity generation figures are measured in units of 103-megawatt-hours (MW-hr). For the sake of the discussion here, lets assume a large utility scale power plant is 1000-MW in size. There are 8,760-hours in a year. So, a 1000-MW plant running 24-hours a day, 365 days per year would generate 8.76-million MW-hr, or, 8,760 x 103 MW-hr. As the total electrical consumption in the US is roughly 4,000,000 x 103 MW-hr and if, for discussion purposes, it is assumed that a plant will generate 75% of the power it is capable of, (1), then it will take approximately 610 utility sized power plants to provide all the electricity the US consumes. Not only is the electrical generating industry - far and away - the most important industry in any modern society, it is the most capital intensive as well. The amount of physical and investment capital tied up in these 600+ 'utility sized' electric generating plants dwarfs those in any other industry.
TABLE 1
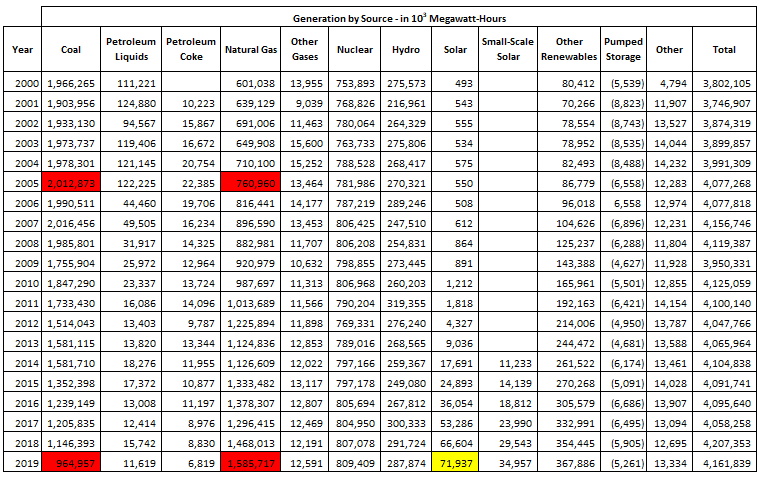
The enormous importance and size of the electrical generating industry notwithstanding, it has been subjected to enormous amounts of central planning because of 'climate change' (nee' global warming). Specifically, there has been a multifaceted effort to reduce the amount of CO2 that is produced when the electricity in Table 1 is generated. From the government's perspective, all this effort has been focused on increasing the production of renewable energy. This single-minded zeal notwithstanding, increased production of renewable energy isn't even the largest source of reduced CO2 from electricity production. This is shown in Table 2.
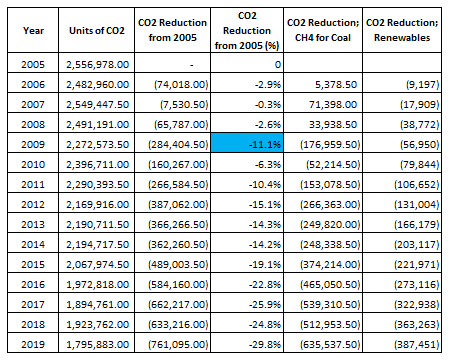
Table 2 calculates the 'relative' amount of CO2 associated with the production of electricity for the years 2005 - 2019. (2) The selection of 2005 as the baseline year was not arbitrary. 2005 was the baseline year in President Obama's 'Clean Power Plan.' The objective of this plan was to reduce the CO2 produced by the generation of electricity by 32% from 2005 levels. Chart 2 shows total CO2 production is down over 760,000 units from its 2005 amount (29.8%). However, Chart 2 also shows the majority of this CO2 reduction is not from renewables. Instead, it is from replacing coal-fired electricity with natural gas-fired electricity. Fully 62% of the CO2 reductions captured in Table 2 are from replacing coal with natural gas, see the cells highlighted in red; only 38% is from the increased production of renewable energy.
TABLE 2:
The fact that the focus of the central plan to reduce CO2 - increasing renewable energy production - isn't the largest source of reduced CO2 isn't the end of the story. The myopic central planning focus on increasing renewable energy production could soon lead to CO2 increasing! This can be seen by examining Table 3.
Table 3 shows the nuclear power plants that have closed and will be closing soon. With the exception of the San Onofre units - which were the focus of another article on the site, (3) - all of these proposed closings are largely due to economics. All these power plants were built decades ago and are fully depreciated. They should be throwing off huge amounts of cash. Why are these nuclear plants so unprofitable? Its a simple answer - increased electricity production from renewable energy (wind and solar).
TABLE 3
![]()
The issue with nuclear power plants is they can't cycle up and down. Plants fired by natural gas and coal can ramp their production up and down to meet changes in demand. Of course, operators of these plants would prefer to produce as much power as each plant can generate, but the plants can operate at widely varying production rates. Nuclear reactors don't have this operational flexibility. It is largely a matter of reactor physics, (4), and nuclear plants have to operate at their "base load."
While changes in electricity demand have always existed, a new phenomenon in today's market for electricity is large changes in electricity production because of renewables. The electricity produced by wind and solar is not constant, it varies greatly throughout each day. As this renewable energy generation cycles up and down, the rest of the electricity generating grid is forced to change its production to match these changes. However, nuclear plants can't adopt to these changes. As a result, they are often producing electricity when the electricity is not needed by the grid. In these cases the nuclear plants have to pay the grid to take the electricity off their hands. As more and more renewable energy is added to the grid, the problem is becoming more acute. In fact, several other reactors could soon be added to the list of reactors slated to be closed.
It is enlightening to compare the amount of electricity generated with solar in 2019 with the amount of energy that could have been produced by the reactors already taken out of service. Table 1 shows that just under 72,000 x 103 MW-hr of electricity were produced with solar in 2019, highlighted in yellow. However, the reactors that have already been closed would have produced almost 68,000 x103 MW-hr of electricity! Over the next few years - as even more reactors are shut down - the lost 'CO2-free' energy production from closed nuclear reactors will exceed the amount of 'CO2 free' energy produced by solar.
So, the central plan to reduce CO2 production from electricity generation by increased production of renewable energy has greatly undermined the largest source of 'CO2 free' electricity generation, nuclear. Going forward, the only way to replace the losses in nuclear generation will be from gas fired power plants. When this starts to happen, the reductions in CO2 that have been achieved will start to be undone. As each unit of nuclear energy production is replaced with gas, the production of CO2 associated with electricity will reverse course and begin to increase.
CONCLUSION:
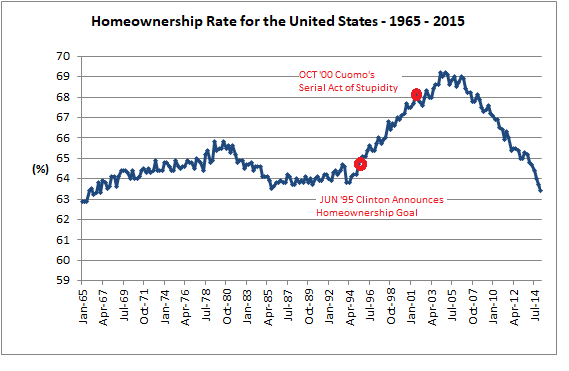
The fact that the central plan to reduce CO2 by increasing renewable energy production could soon lead to increases in CO2 shouldn't be surprising. Indeed, these are the results that central planning has always produced. A recent example of central planning's perfect record of failing to deliver is President Clinton's 'strategy' to increase homeownership to 67.5%. The collapse of the Soviet Union just a few years before should have convinced the Clinton White House of the perils of central planning. Unfortunately this wasn't the case, and the country paid an enormous price for their arrogance. Chart 1 shows the homeownership rate for the years 1965 - 2015. The impact of President Clinton's how ownership strategy is clearly seen, and certainly looked to be successful. However, as successful as it might have looked in the short-term, it was disastrous over the long-term. When the housing market finally bottomed, homeownership rather than being at all-time highs, was at 50-year lows!
Let's see what the next few years bring in the electricity generating market.
CHART 1
Peter Schmidt
Sugar Land, TX
March 14, 2021
PS - As always, if you like what you read, please register with the site. It just takes an e-mail address and I don't share this e-mail address with anyone. The more people who register with the site, the better case I can make to a publisher to press on with publishing my book. Registering with the site will give you access to the entire Confederacy of Dunces list as well as the financial crisis timeline.
Help spread the word to anyone you know who might be interested in the site or my Twitter account. I can be found on Twitter @The92ers
ENDNOTES:
1. This is the capacity factor, CF, of a power plant. For a variety of reasons, a power plant won't be producing all the power it can, even when it is running. Of course, when a power plant is down for maintenance or any sort of operational upset, then it isn't producing any power at all. The capacity factor accounts for this.
2. The relative CO2 levels associated with power generation are relatively straightforward to calculate. For the data here I used a value of '1-unit of CO2' to correspond to energy generation with coal, coke or other gases. Because natural gas generates about 50% of the CO2 a coal plant does, a value of 0.5-unit of CO2 was assigned to natural gas generation. Nuclear, hydro, solar and other renewables all had a value of '0-unit of CO2' applied to their generation.
3. http://www.the92ers.com/blog/computers-economists-disastrous-combination-part-ii-ii-when-engineers-act-economists
4. For those that saw the 'Chernobyl' miniseries, recall that Reactor #4 was 'poisoned' by the production of Xenon when it operated at reduced load in the hours leading up to the accident. It was the subsequent collapse in reactivity, that then prompted the operator supervising the test, Anatoly Dyatlov, to order technicians to keep removing control rods from the reactor in a misbegotten attempt to complete the safety test they were supposed to run.