
The Fed as Public Enemy #1 - Modern Monetary Policy and the Destruction of Working Class Incomes
When currency was backed by gold, a central bank's main function was to maintain the value of the issued currency in terms of gold. For example, if a central bank created too much money against the gold reserves in the banking system, an increasing number of people would begin to exchange their currency for gold. These people would do this out of concern that the increased money supply would reduce the money's value. (Gold would maintain its value but the depreciating currency wouldn't.) To combat this, a central bank would be forced to raise interest rates and reduce the money supply. The higher interest rates would incentivize people to exchange gold for larger bank savings on deposit that earn interest. Banking reserves - gold - would return to the banking system and the economy would return to balance.
The prime reason for insisting on defining currency in terms of a precious metal was to provide a self-correcting braking mechanism to the creation of money. As expressed by the great Wilhelm Ropke;
"If in the production of goods the most important pedal is the accelerator, in the production of money it is the brake. To insure that this brake works automatically and independently of the whims of government and the pressure of parties and groups seeking 'easy money' has been one of the main functions of the gold standard. That the liberal should prefer the automatic brake of gold to the whims of government in its role of trustee of managed currency is understandable." (1)
The US dollar was backed by gold as recently as 1971. Any central bank in the world could present the Federal Reserve $35 and receive 1-ounce of gold in exchange. However, on August 15, 1971 - and blaming it on the 'gnomes of Zurich' - President Nixon temporarily broke the dollar's last link with gold. Nixon closed the gold window and reneged on the promise to exchange an ounce of gold for $35. Since then, the system of credit in the US has been under the Fed's complete control. Unsurprisingly, without the natural braking action provided by gold, the value of the dollar has collapsed and the ensuing 45-years are the most crisis-ridden period in American economic history. (2)
The case against modern central bank policy - and the fallacy-riddled economic theories that provide the theoretical basis of modern central banking - can be made in a number of ways. A method - which enjoys the advantage of hoisting Ben Bernanke on his own mathematical petard - is to use economic statistics from two eras, 1967 and 2015. One of the reasons Ben Bernanke is such a big fan of baseball is his fondness for statistics. In baseball, like few other sports, players from one era can be compared to players from other eras because the game has changed so little. Because of his fondness for baseball statistics and their constancy over time, Bernanke should be sympathetic to the data presented here - even if it exposes the enormous damage the Fed's monetary policy has visited upon hundreds of millions of hard-working Americans.
The chart below speaks volumes about the disastrous impact of Fed policies since 1971. The chart reveals how the credit inflation the Fed created, actually masks this impact. Specifically, the Fed-induced inflation makes it difficult for the average worker to realize that even though their salaries have soared in dollar terms, these salaries now purchase much less than they used to.
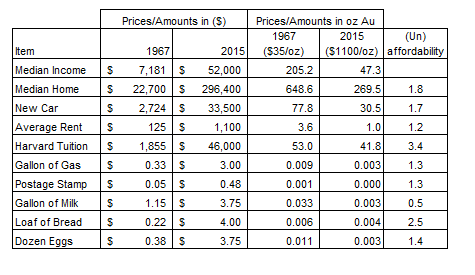
The chart lists prices for several common items (3), as well as average incomes (4) and home prices (5) for the years 1967 and 2015. In addition, to defining prices and incomes in dollars, prices and incomes are defined in their equivalent amounts measured in ounces of gold. The equivalent "ounces of gold" are simply determined by taking the price in dollars and dividing it by the prevailing price of gold for the time period under review.
As a result of the collapsing value of the dollar - it is worth less than 3% of its 1971 equivalent in gold terms - it is not completely straightforward to compare economic performance in 1967 with the performance today. When prices and incomes are measured in dollars they appear to be soaring - annual incomes have risen from $7,181 per year to $52,000. However, when these same incomes are measured in ounces of gold, they appear to be collapsing - falling from 205.2-ounces per year to just 47.3. What is going on?
Because money - whether it manifests itself as a paper currency issued by a central bank or a constitutionally proscribed amount of precious metal - is merely a store of wealth and a means of exchange, the impact of monetary policy is best demonstrated by comparing what the average person can purchase with his/her salary today versus 1967. The last column in the chart measures how much more unaffordable everyday items have become to the average worker, and does so without using dollars or gold. Instead, this column computes the cost of an item on the basis of the median worker's income for both 2015 and 1967. A ratio of these two costs is then taken with the 2015 cost in the numerator. (Any ratio greater than 1.0 indicates that the item has become more expensive to the average worker since 1967.)
For example, let's examine home prices. In 2015, a house cost the average worker 5.7-times their annual income (296,400/52,000). In contrast, in 1967 the median house cost the average worker just 3.06-times their average annual income (22,700/7,181). Measured, against the average worker's income, today's house costs 1.8-times more than its 1967 equivalent (5.7/3.06)! With the exception of a gallon of milk, every item in the chart has become more expensive to the average worker since 1967. (Note also that nothing has become more unaffordable to the average working person than the cost of a private college education.)
In conclusion and as shown here, when prices of goods are measured in terms of incomes, we can clearly see that today's incomes purchase much less than they used to. The clearly demonstrated fact that the average worker - the backbone of any economy - has been falling behind for decades on end shows the problems with the US economy are deep, systemic and long-running. (6) As evidenced here, these problems clearly have their origin in the Fed's monetary mismanagement and the resulting failure of the dollar to maintain even a small fraction of its value over time.
Peter Schmidt
November 11, 2018 (Veterans Day)
PS - As always if you like what you read, please consider registering with the site. It just takes an e-mail address, and I don't share this e-mail address with anyone. The more people who register with the site, the better case I can make to a publisher to press on with publishing my book! Registering with the site will give you access to the entire Confederacy of Dunces list as well as the Financial Crisis timeline. Both of these are a treasure trove of information on the crisis and the long-running problems that led to it.
ENDNOTES:
(1) Wilhelm Ropke, Economics of a Free Society, Ludwig von Mises Institute, Auburn, AL, 2008, p. 100
(2) August 15, 1971 was a watershed event in the United States; the future direction of the country was fundamentally - and catastrophically - altered on that day. See two blog posts for additional details;
http://www.the92ers.com/blog/august-15-1971-nixon-temporarily-closes-gold-window-opens-door-inflationary-chaos-and-wealth
http://www.the92ers.com/blog/august-15-1971-nixon-temporarily-closes-gold-window-opens-door-inflationary-chaos-and-wealth-0
(3) New car price from James R. Healy, "Average New Car price Zips 2.6% to $33,560," USA Today, May 04, 2015 https://www.usatoday.com/story/money/cars/2015/05/04/new-car-transaction-price-3-kbb-kelley-blue-book/26690191/
(4) US Department of Commerce, Bureau of Census, "Household Income in 1967 and Selected Social and Economic Characteristics of Households," Series P-60, #62, July 15, 1969 https://www2.census.gov/prod2/popscan/p60-062.pdf
(5) US Census, Median and Average Sales Prices of Houses Sold by Region; Note that while the "average" home price in 2015 was $296,400, the "median" price was $352,700. Even more amazingly, the "median" price for a home in the northeastern US was a staggering $572,700, nearly twice the US average! The much higher median value for both the US and, especially, the northeastern US reflect the enormous concentration in wealth and the financialization of the US economy made possible by the Fed's monetary policy. https://www.census.gov/construction/nrs/pdf/pricerega.pdf
(6) In 1958, of the nearly 59-million tax returns filed in the United States, only 236 showed incomes of $1-million or more, and only 115,000 tax returns showed incomes in excess of 50,000. Fifty-eight years later the median income in the United States is $50,000 and yet the average working family has never been under more financial stress. The failure of the dollar to serve as a unit of economic measure over time is conclusive evidence of the disastrous impact resulting from decades of Federal Reserve incompetence! For income tax data, see Ropke, Economics of a Free Society.