
H.L. Mencken was Correct; Alexandra Ocasio-Cortez, Ed Markey and the Green New Deal Proves It
The journalist H.L. Mencken famously said, "The whole aim of practical politics is to keep the populace alarmed, and hence clamorous to be led to safety, by menacing it with an endless series of hobgoblins, all of them imaginary." Menken had a caustic wit and had soured on many things. Nevertheless, there is considerable merit to his opinion on politics and politicians. Indeed, the cataclysmic consequences that have confidently been invoked by Congresswoman Alexandra Ocasio-Cortez, (D-NY), and her senate counterpart, Sen. Ed Markey (D-MA) around their 'Green New Deal' (GND) appear to have been written in jest by Mencken himself. Over the next few blog posts, some context to the GND will be provided. In this blog post, the context will be limited to;
- how much electricity is produced in the US
- how this electricity is produced
- how many power plants it takes to produce electricity in the US
- the role renewable energy, the cornerstone feature of the GND, has played in reducing the amount of CO2 produced in the generation of electricity
- the inherent contradictions of the GND that would undermine the already considerable reduction in CO2 emissions from electricity generation
Ocasio-Cortez is not out of her twenties and Markey has been a professional politician since 1973. Their complete lack of experience with private industry would appear to explain the ignorance that lies at the core of the GND, and the completely confidence with which this ignorance was then trumpeted to the public. The confidence with which the GND was announced was not matched by the organization around the plan itself. In its first iteration, announced on February 7, the GND called for net-zero greenhouse gas emissions in 10 years. What are some of the implications associated with this objective?
The first step in assessing the implications of the GND is to assess the role electricity plays in the US economy and standard of living. In Chart 1, below, the generation of electricity in the US is plotted from 1950 through 2018. (1) Like no other statistic, electricity generation provides the best proxy for the health of the US economy. Note in particular, the linear increase in electricity generation from 1950-2000. The average annual increase in energy generation during this period was approximately 4.8% per year. There are only a few exceptions to this linear trend - 1965, (LBJ's Great Society programs and increased war spending in Vietnam, and 1980, (the steep recession following the Fed-fueled inflation of the 1970s).
Chart 1
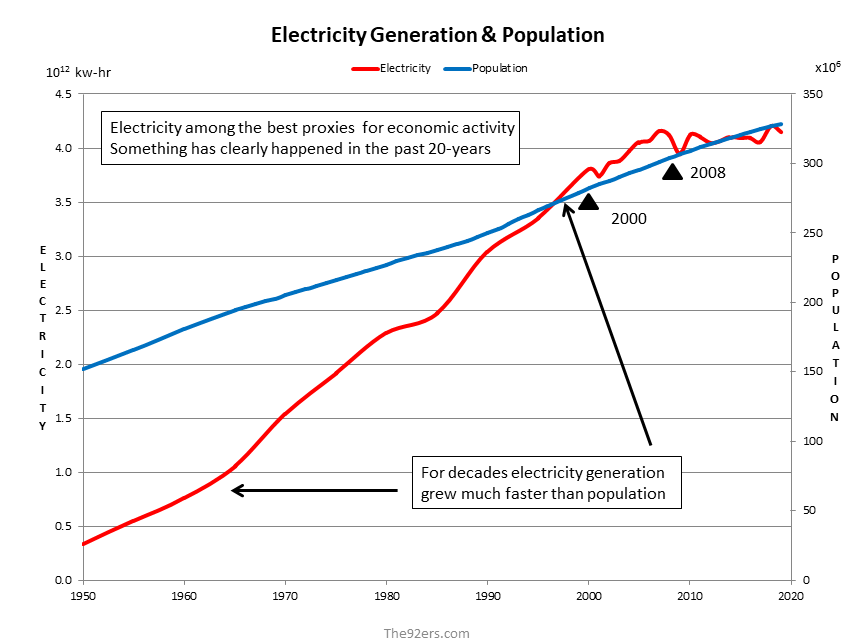
However, note that since 2000 the trend that existed for the previous fifty years is no more. Following the 2000 tech bubble and, particularly, the 2008 financial crisis, electricity generation is not growing as it was previously. This lack of growth in electricity generation is not the result of people using LED light-bulbs. Instead, it is the result of large parts of the US being de-industrialized. (Industry is a much larger consumer of electricity than households.) As this chart makes clear, the economy - outside of Wall Street finance - is still reeling from the 2008 financial crisis and has been fundamentally altered. (This chart also provides the best explanation for Donald Trump's election, his victories in Michigan, Ohio, Pennsylvania and Wisconsin in particular.) For the sake of this discussion, the key point to remember - and the point proven by Chart 1 - is electricity generation is inextricably linked to economic activity - read production - and the standard of living. The notion that two people - professional politicians with almost no 'real world' work experience - could confidently outline a plan that would completely turn the electricity industry upside down should be self-evidently laughable. (2)
Chart 2 provides additional data around electricity generation. Specifically, Chart 2 shows not only how much electricity was generated for the years 2005 - 2018, it identifies how this electricity was generated. (The significance to the year 2005 will be described in Chart 4 below). This is a very dense chart with a tremendous amount of data, all which also comes from the Energy Information Administration, see (1). Some perspective on these numbers is required.
Chart 2
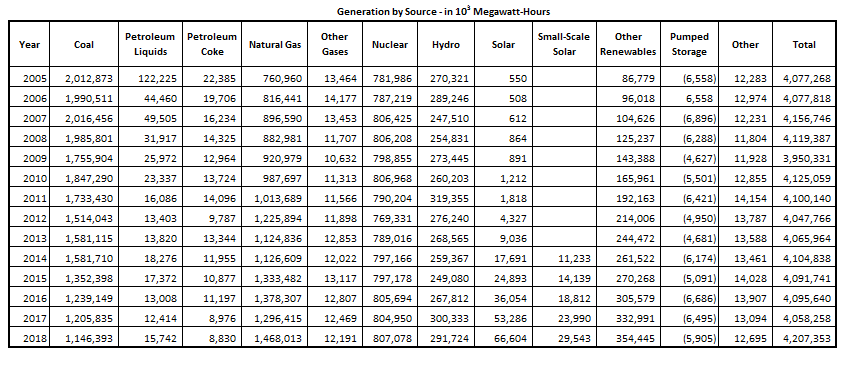
The electricity generation figures are measured in units of 103-megawatt-hours. For the sake of the discussion here, lets assume a large utility scale power plant is 1000-MW in size. There are 8,760-hours in a year. So, a 1000-MW plant running 24-hours a day, 365 days per year would generate 8.76-million megawatt-hours of power, or, 8,760 x 103-megawatt-hours. If we look at the amount of energy generated with coal in 2005, 2,012,873 x103-megawatt-hours, and use the 8,760 x103-megawatt-hour figure for a single 1000-MW plant, then we see that it took approximately 230 utility sized coal plants to produce this amount of energy. Conversely, in 2018, only 1,146,393 x 103-megawatt-hours of electricity were generated with coal. This corresponds to only approximately 131 utility sized coal plants. Of course the greatly reduced energy generation from coal has led to the bankruptcy of one coal mining company after another.
Looking at the data collectively, in 2018 and using the same figure of 8,760 x 103-megawatt-hours per utility sized power plant, the total electricity generation in the US of 4,207,353 x 103-megawatt-hours would take 480 utility sized power plants. If instead of being available to operate 100% of the time, the power plants were available 85% of the time, then the total number of power plants required to generate America's electricity is 565. (480/0.85). The total investment in this plant and equipment is in the many trillions of dollars. The GND would virtually wipe-out the value of all this capital investment. The financial cataclysm produced by this write-down of asset value would make the 2008 financial crisis tame by comparison.
With some understanding of the infrastructure required to generate all the nation's electricity and the financial consequences associated with making all this infrastructure redundant, the following facts around energy production gleaned from Chart 2 warrant discussion;
- For the entire fourteen years under review, total power generated increased by only 3.2%, considerably lower than the average annual increase for the years 1950-2000, 4.8%. (See Chart 1 as well)
- The amount of energy generated via dams (hydroelectric) and nuclear has changed very little.
- The amount of energy generated by coal has substantially decreased, down by almost 900,000 x103-megawatt-hours, over 40% from its 2005 level
- The vast majority of the reduced electricity from coal has been compensated for by increased electricity from natural gas, up over 700,000 x 103-megawatt-hours since 2005, fully 93%.
- Electricity from all renewables is up markedly. However, while the relative rate of increase is high, the absolute generation of electricity from renewable energy is still relatively small.
- Total energy generation from all renewable sources in 2018 was 450,592 x 103-megawatt-hours, and lags well behind the energy generation of nuclear, coal and natural gas.
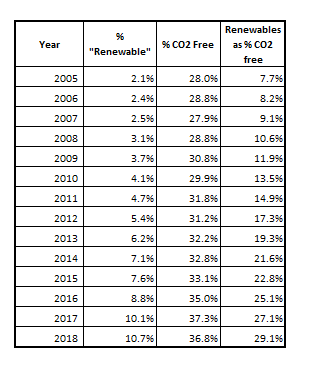
Not only is 'renewable energy' such a small part of total energy generation, it is a small part of CO2 free energy generation! (3) Chart 3 shows the amount of energy generated by renewables, the total energy generated by CO2 free technologies and the amount of CO2 free energy that is from renewables, all expressed as percentages. It is this chart, more than any other that completely exposes the lunacy of the GND. After more than thirteen years of non-stop investment in renewable energy, renewable energy still only accounts for just 10% of total energy generation. Moreover, renewables only account for 29.1% of all electricity generated with CO2 free technologies! The single animating force behind the GND is the notion that all of the US' electricity needs can be met with renewable sources like solar and wind. This belief is contradicted by the indisputable fact that renewables aren't even our largest source of CO2 free energy, nuclear is, and in its original form, the GND called for the elimination of nuclear power
Chart 3
The fact that the data in Charts 1 - 3 starts with the year 2005 is no accident. In 2015, the Obama administration attempted to implement a "Clean Power Plan," (CPP). The goal of the CPP was to reduce the amount of CO2 produced from electricity generation by 32% from its 2005 level by the year 2030. The plan has been challenged in court and, upon his election as president, Donald Trump, has been deeply skeptical of the plan. My understanding is that the CPP never formally went into effect. Nevertheless, as the data in Chart 4 indicates, the goals of the CPP have almost been achieved! (4) Of primary importance to the discussion here, it is important to realize that the enormous progress already made in reducing CO2 didn't require a radical plan that would place the single most critical sector of the economy - electricity generation and distribution - into the hands of a bunch of power-mad politicians and zealots! (Note that the highlighted data for the year 2009 vividly displays the enormity of the economic damage resulting from the 2008 financial crisis and the impact this had on electricity generation.)
Chart 4
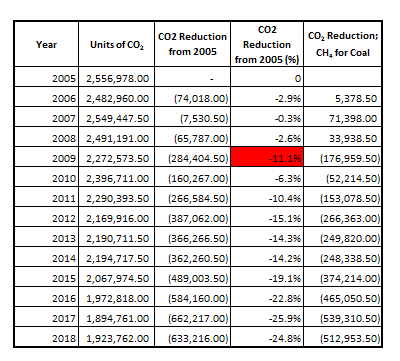
Note from Chart 4 that total CO2 production is down over 600,000 units from its 2005 amount (25.9%). The majority of this CO2 reduction is not from renewables. Instead, it is from replacing coal-fired electricity with natural gas-fired electricity. This volume of reduced CO2, 512,953.5-units, dwarfs the reduction in CO2 resulting from the increase in renewable energy generation for the years 2005-2018, just 360,313-units. (5). In other words, almost 60% of the reduction in CO2 since 2005 is from replacing coal with natural gas, not increasing renewables.
What then explains the enormous increase in natural gas-fired electricity? In a single word, fracking. In 2008, an enormous facility designed to received liquefied natural gas (LNG) was commissioned in Sabine Pass, Louisiana. The idea was LNG would need to be imported into the US, and this facility was built to 're-gassify' the LNG and distribute it as natural gas. Fast forward a few years and this facility has been repurposed to export millions of tons per year of LNG! The amount of natural gas that new drilling techniques have allowed to be placed into production is simply staggering. Not only have these drilling techniques led to enormous growth in energy production in typical oil and gas producing states like Texas and Louisiana, these same techniques have led to booming energy production in Ohio and Pennsylvania (Marcellus Formation) and North Dakota (the Bakken Field) .
The role that fracking has played in the increased production of natural gas - and thus the very large reductions in CO2 generation during the production of electricity - highlights the hopelessly confused and contradictory nature of the GND. The GND would almost certainly ban fracking. Yet fracking is the main reason so much less CO2 is being produced by the generation of electricity. The simple fact of the matter is the production of electricity is completely interwoven into all aspects of any modern society. Changes - even relatively small changes - to how this electricity is generated or the cost of the electricity - can't help but have huge ramifications throughout the entire economy. More often than not, these ramifications will not be the result of any sort of relationship or connection that can be seen in advance. The ramification will only become obvious when the economic damage and dislocations become manifest. After all isn't this the lesson of central planning, and the experience from any central planning exercise? What is the GND other than a massive central planning exercise and an enormous increase in the size, scope and power of government in exactly the way Mencken warned about?
Resources like coal and natural gas are finite and they should not be squandered. (Note, oil has almost no role in the generation of electricity - at least in the United States.) For example, many of the coal plants that have been removed from production in the US were very old and used 'sub-critical' technologies. The coal plants that now remain are largely 'supercritical' coal plants and operate at much higher steam pressures. The higher pressures allow these new plants to generate approximately 35% less CO2 than their sub-critical counterparts. (The reduction in CO2 is the result of supercritical plants being about 35% more efficient than sub-critical plants in turning the energy contained in the coal into electricity.) Substitution of supercritical coal for sub-critical coal represents a substantial reduction in CO2 and allows an abundant natural resource, coal, to be used in the most efficient way possible, while minimizing economic dislocations.
However the GND - by edict of a twenty-something and a professional politician - would prevent technically and economically feasible reductions in CO2 generation such as this from being implemented. Instead, the GND - animated as it is by political grandstanding, economic naivete and comprehensive technical ignorance, and shielded from its many errors by a sympathetic media - insists upon completely impractical solutions in completely unrealistic timelines - by 2030 for example!
In next week's blog post - yes, there will be one next week, I promise - the impractical nature of the GND will be discussed. The impractical nature of the GND will be highlighted by the dismal progress the states of Massachusetts (Markey's homestate) and New York (Ocasio-Cortez's homestate) have made towards a transition to renewable energy.
Peter Schmidt
Sugar Land, TX 77478
April 14, 2019, Palm Sunday
PS - As always if you like what you read, please consider registering with the site. It just takes an e-mail address, and I don't share this e-mail address with anyone. The more people who register with the site, the better case I can make to a publisher to press on with publishing my book! Registering with the site will give you access to the entire Confederacy of Dunces list as well as the Financial Crisis timeline. Both of these are a treasure trove of information on the crisis and the long-running problems that led to it.
ENDNOTES
(1) Energy Generation Data is from the Energy Information Administration, EIA. The link here provides data for the years 2007-2017. https://www.eia.gov/electricity/annual/html/epa_03_01_a.html
(2) The confidence with which Ocasio-Cortez and Markey introduced a plan on a topic they know virtually nothing about when that topic has such wide-ranging potential impacts on the economy has a single parallel. In spite of no experience in the banking or mortgage industry, Bill Clinton (Dunce #12) and his two housing secretaries - Henry Cisneros (Dunce #11) and Andrew Cuomo (Dunce #16) - re-wrote mortgage lending standards to ensure their goal of 67.5% homeownership was reached. The homeownership goal was reached, but reaching it brought the US economy to its knees. http://www.the92ers.com/dunce/bill-clinton
(3) Included in the 'other' types of renewable energy is 'biomass.' While burning biomass is 'renewable', it is not CO2 free. When you burn wood, the CO2 that was absorbed by the tree is then released upon burning. Because 'other' renewables is dominated by the production of energy using wind, which is of course free of CO2 emissions, 'other' renewables will be considered CO2 free even though as defined here they are not.
(4) The relative CO2 levels associated with power generation are relatively straightforward to calculate. For the data here I used a value of '1-unit of CO2' to correspond to energy generation with coal, coke or other gases. Because natural gas generates about 50% of the CO2 a coal plant does, a value of 0.5-unit of CO2 was assigned to natural gas generation. Nuclear, hydro, solar and other renewables all had a value of '0-unit of CO2' applied to their generation.
(5) In 2005, total renewable energy generation was 87,279x103 megawatt-hours of electricity. That increased to 447,592 x103-megawatt-hours, or an increase of 360,313 x103-megawatt-hours.