
No Blood, No Body, We Hit Nothing! - The Fed's Version of Predator - Part II
DISCUSSION
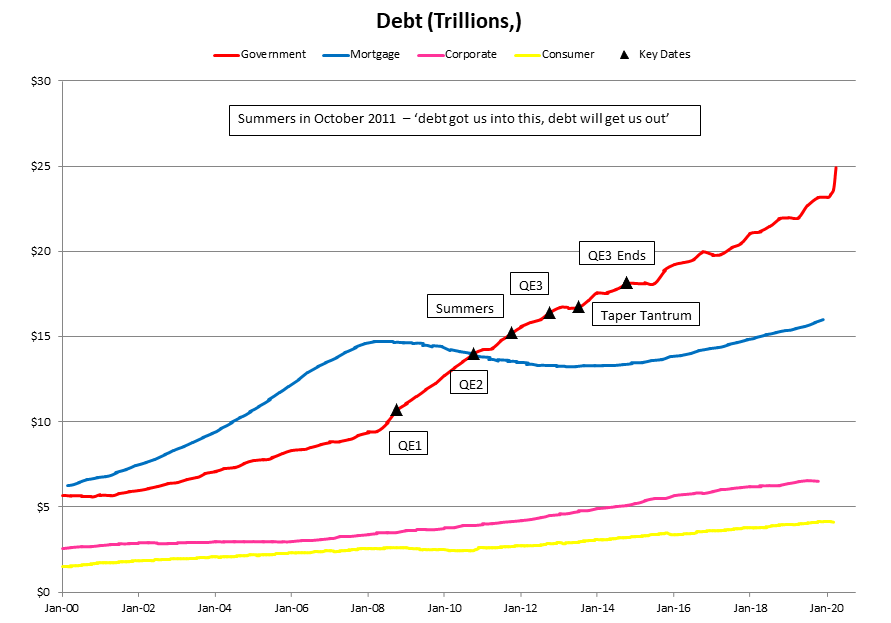
In last week's article, the Fed's actions after the 2008 crash were likened to the iconic 'ammo dump' from the action-movie classic, "Predator." The Fed's response can be seen in Figure 1 below. According to the MIT PhDs at the Fed, the solution to a crisis brought on by too much debt was to go deeper into debt. Debt of all types exploded. Even mortgage debt - the source of the financial crisis - eventually climbed past its housing bubble peak.
FIGURE 1:
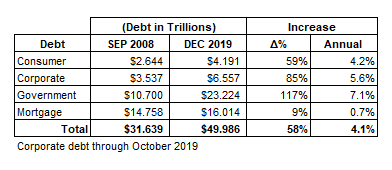
In tabular form;
TABLE 1
As simple common sense would dictate, solving a problem caused by too much debt with even more debt was doomed to failure - and fail it did. In this week's article, the 'we hit nothing' part of the Fed's post-2008 crisis response will be discussed. This will be done with the help of three charts - Figures 2-4.
Figure 2 simply compares the economic expansion after the 2008 debacle with all other post-war expansions. While the 2008 'expansion' - and the 'expansion' aspect will discussed in more detail in the context of Figure 4 - was the longest, it was among the weakest. Typically, the size of the economic collapse that precedes an expansion and the size of that expansion are related. In particular, the larger the collapse, the stronger the subsequent rebound. From a logical perspective, this makes sense. An economy subject to massive distortions that collapses, is then poised for rapid growth when these distortions are eliminated. The reason being, the industries best positioned for growth don't have to compete for resources with the industries that were expanding on the basis of unsound business plans.
FIGURE 2:

One implication of the post-2008 expansion being so weak is the preceding distortions that produced the 2008 collapse were never addressed. Of course, this implication is confirmed by the huge explosion in debt that accompanied the meager post-2008 growth, see Figure 1. In particular, debt wasn't reduced after 2008, debt of all types exploded! As more and more debt produced smaller and smaller levels of growth, the economy became weaker, even as it was supposed to be recovering! As further evidence of this dynamic, see the 2001-2007 expansion that followed the collapse of the Fed fueled bubble in tech stocks. (Figure 2) This expansion was also among the weakest, and it was so for the same reason as the post-2008 expansion. Instead of allowing the economy to address the distortions of the tech bubble era, the Fed short-circuited this healing process by making it easier and easier for firms to borrow. In doing so, the Fed perpetuated much of the same stupidity that fueled the tech bubble.
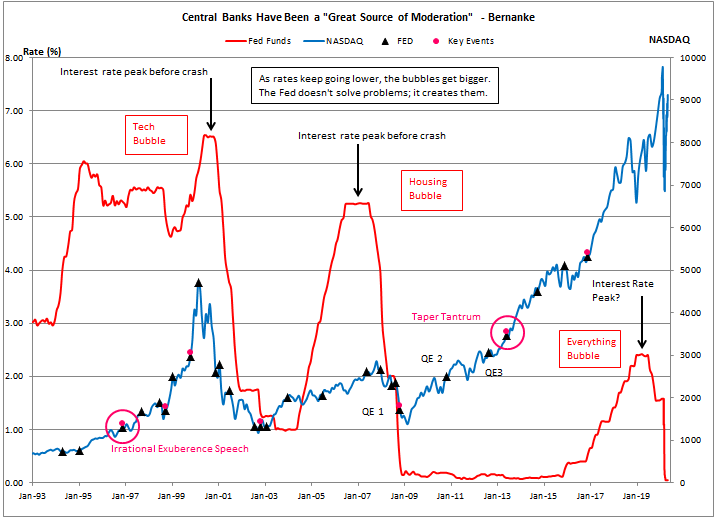
Indeed, isn't the Fed short-circuiting the economy's natural healing process and perpetuating even larger distortions perfectly demonstrated by Figure 3? Note that with each subsequent bubble bursting - tech stocks, housing and today's everything bubble - the subsequent Fed interventions become larger and larger. As the interventions become larger, so do the economic distortions in terms of enormous assets bubbles. It is a grim chart and the Fed is completely ignorant of it.
FIGURE 3:
As a mechanical engineer who spent about 10-years working on power plants, I have to confess a certain fondness for Figure 4. Figure 4 is a plot of US electricity generation and population from 1950 to the present. For much of this time, electricity generation was among the best proxies for economic activity. In other words, the growth in electricity generation accurately mirrored the growth of the overall economy. The correlation wasn't perfect; note for much of this time electricity generation grew much faster than population. (this can be seen by the slope of the two curves). Looking at the 1950s, not only was there the post-war industrial boom in cars and housing, but all sorts of energy intensive products - air conditioning is the first that springs to mind - became far more widespread. The result was electricity use grew much faster than population.
FIGURE 4:
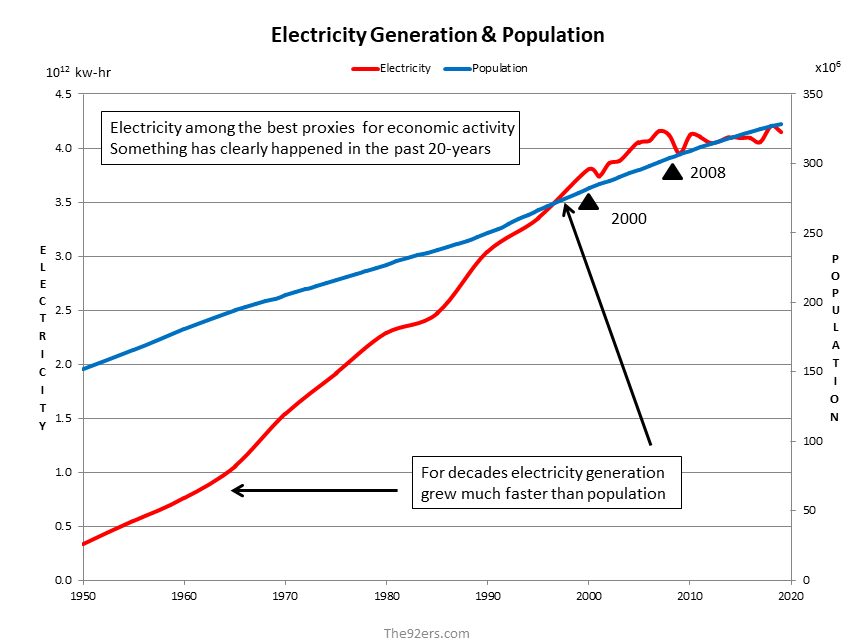
Outside of the obvious dip in electricity generation after the tech bubble burst in 2000, electricity generation continued to grow into the new millennium - albeit now at a reduced rate. However, there is an obvious discontinuity in electricity generation beginning in 2008, the year the financial crisis began. Unlike what happened after the tech bubble bursting, electricity generation never resumed its growth after 2008. From 2008 through 2019, the United States added 22-million people, basically the population of Florida, and electricity demand hardly budged! Moreover, think of the increased use of electrical vehicles over this period of time as well as the increased electricity demand from the constantly expanding use of the internet, larger computer networks and the explosion of cellular technologies - cell phones and cell phone servers run on electricity and plenty of it!
The flat-lining of electricity generation after 2008 is a consequence of the real, productive part of the economy stagnating, not the increased use of LED light bulbs! While Figure 2 has the advantage of making a 'relative' comparison of the post-war expansions using the same metric of economic growth, the drawback to Figure 2 is the imprecise nature of exactly how best to measure 'growth' in an economy the size and complexity of that in the United States. The use of Gross Domestic Product (GDP) is far from ideal and misses many important aspects of what real productive economic effort is. (1) The 'growth' measured Figure 2 doesn't distinguish between growth originating in an enormous and unsustainable asset bubble - (which generates huge sales of rare art, classic cars, yachts and trophy homes) - and the growth associated with increased physical production and a truly wealthier society. Figure 4 provides insight into the nature of the economic growth displayed in Figure 2. As Figure 4 indicates the 'growth' associated with the post-2008 'expansion' is not comprised of increased physical production and a wealthier society.
CONCLUDING REMARKS - WE HIT NOTHING!
As discussed here, not only was the post-2008 recovery among the weakest of all post-war recoveries, what little growth it produced wasn't associated with increased physical production and a wealthier society. Instead, the growth appears to be a consequence of yet another enormous Fed fueled asset bubble. After all, it takes very little electricity for a realtor to ask $45-million for the penthouse in the (south!) San Remo tower when the owner paid just $7-million to buy it! (2)

More on this asset bubble aspect of the post-2008 recovery next week!
(By the way, don't think for one minute I would ever deign it acceptable to live in the north tower. The only penthouse I would ever consider is, of course, in the south tower!)
Peter Schmidt
Sugar Land, TX
May 31, 2020
PS - As always, if you like what you read, please register with the site. It just takes an e-mail address and I don't share this e-mail address with anyone. The more people who register with the site, the better case I can make to a publisher to press on with publishing my book. Registering with the site will give you access to the entire Confederacy of Dunces list as well as the financial crisis timeline.
Help spread the word to anyone you know who might be interested in the site or my Twitter account. I can be found on Twitter @The92ers
ENDNOTES:
1. Whistling Dick, Hank 'the Hammer' Paulson and Hillary Clinton: What Does GDP Tell us About Voters? http://www.the92ers.com/blog/whistling-dick-hank-hammer-paulson-and-hillary-clinton-what-does-gdp-tell-us-about-voters
2. "Demi Moore Finally Sells San Remo Penthouse for a Much Reduced $45-million." Apparently, the apartment was purchased for $7-million in 1990, which means the price of the apartment 'magically' increased by 6.4% per year for thirty straight years! Want to understand how Fed policies make the rich richer? There's no better place to look than Manhattan or Hamptons real estate!
https://www.6sqft.com/demi-moore-finally-sells-san-remo-penthouse-for-a-much-reduced-45m/