
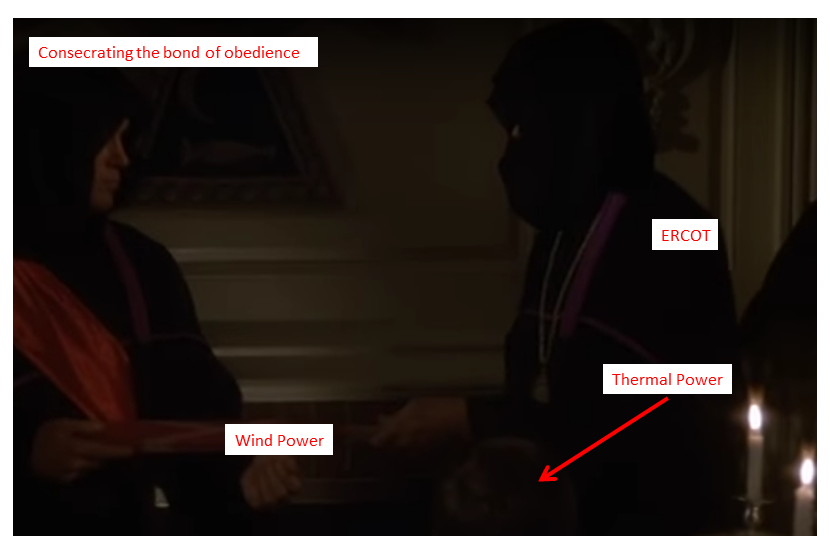
"Thank you sir, may I have another?" ERCOT, Wind and Thermal Power
SUMMARY:
- It takes a crisis like last week's power outage to remind people how dependent society is on electricity and how much we take it for granted.
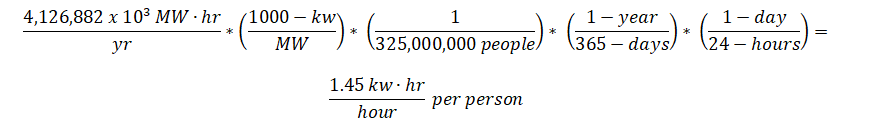
- The per person electricity consumption in the US is 1.45-kw-hr, 24 hours a day 365-days per year. (Fig. 1)
- This power consumption is equal to 2-horsepower or 3.25 'Lance Armstrong's;' it is a staggering amount of power and most people are totally unaware of it.
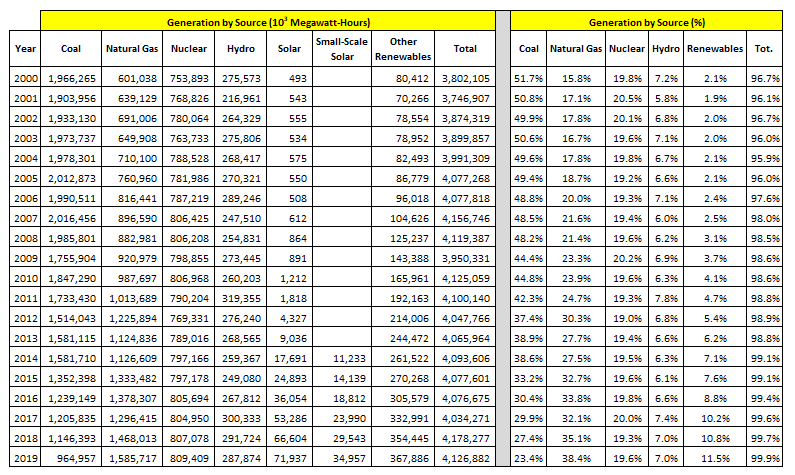
- Over the past twenty years, renewable energy - wind and solar - has become an increasingly large source of electricity, 11.5% in 2019. As large as they've become, wind and solar still badly trail - in order - natural gas (38.4%), coal (23.4%) and nuclear (19.6%). (Table 1)
- Their relatively modest contributions to electricity generation notwithstanding, renewable energy has had a large impact on how the grid operates; this is captured in the 'duck curve.' (Fig. 2)
- As a result of its large dependence on renewable energy, the Texas grid goes through a duck curve.
- Renewable energy holds a privileged position in the hierarchy of Texas electricity sources: it produces its most power when power demand is lowest, and produces its least power when power demand is highest.
- Comparing a cool spring day with a hot Texas summer day reveals almost eight 'power plants' worth of wind comes off-line while thirty-one 'power plants' worth of thermal power has to come on line. (Table 3)
- People who claim 'renewables' had little to do with last week's power debacle in Texas are ignorant of the fundamental changes wind power has imposed on Texas generation.
- Not only must thermal power sources span the enormous gap in electricity demand between low-demand spring days and and high demand summer days, they must also compensate for the accompanying collapse in wind generation.
DISCUSSION:
Last week, my home state - the great state of Texas - was in the news for all the wrong reasons. Huge portions of the state - including where I live - went without electricity as a record breaking cold-snap blanketed the entire state. As if the loss of power wasn't bad enough, many homes also went without water because of either burst pipes or inadequate water pressure in municipal water systems. Of course after any debacle as large as this, there will be a flurry of recriminations. Over the next few weeks, some of the facts and figures around the Texas electricity market will be reviewed. As a preface to that, it is beneficial to review just how reliant any modern society is on the generation of prodigious amounts of electricity. The figures in Table 1 are from the EIA. (1)
TABLE 1
As unaware most people are of how much they depend on electricity for their direct needs like light and air conditioning, they are even more ignorant of the enormous amounts of electricity needed to make all sorts of goods including aluminum, steel, concrete and gasoline to name just a few. To provide some perspective on the enormous demands placed on electricity generation and the total reliance society has on electricity being generated, a simple calculation is in order.
Dividing total electricity generation in the US by the number of people and the number of hours in a year reveals that the per person consumption of electricity in the US is 1.45 kw-hr per hour per person. (See Figure 1) This is approximately 2-horsepower. Another way to look at this consumption figure is to put it in terms of 'Lance Armstrong's.' At the peak of his cycling powers, Lance Armstrong could generate about 450-watts of power for a few hours before collapsing in total exhaustion. (A very healthy person might be able to do that for a minute.) So, the average US citizen has the equivalent of 3.25 Lance Armstrong's ceaselessly working on their behalf, 24-hours per day, 365 days per year.
FIGURE 1
While the enormous dependence on electricity isn't a new development, how that electricity is generated is undergoing profound changes. See Table 1 and note that since 2000, coal has dropped from 52% of electricity generation to just 23%. In that same time, natural gas use has soared from under 16% of generation to over 38%, while renewables have gone from 2% to over 11%.
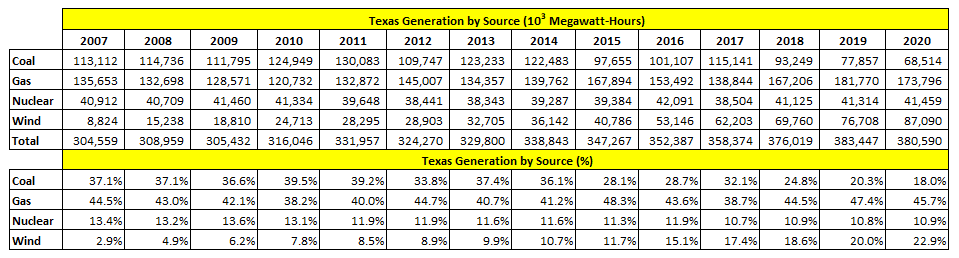
These national trends are also seen in Texas, see Table 2. (2) Specifically, note that the use of coal has also been cut in half while the use of natural gas and renewable energy, (almost exclusively wind in Texas), have greatly increased.
TABLE 2
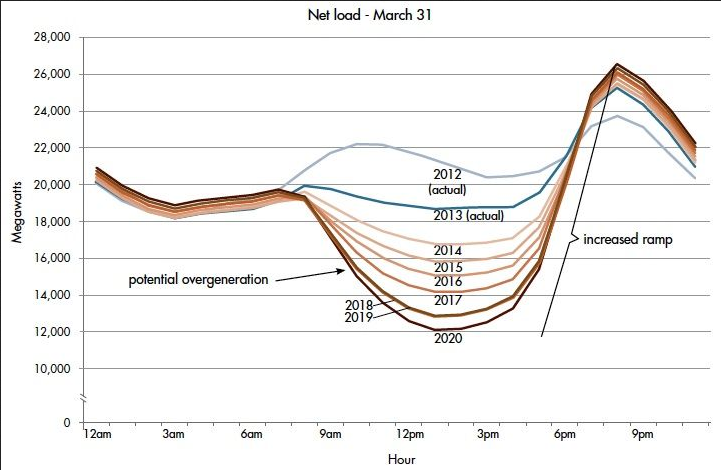
As the use of renewable energy has increased, this energy has placed more and more stress on the grid. This stress is captured by the 'duck curve,' see Figure 2. The duck curve - which was first noticed in California - describes how non-renewable sources of energy are forced to go through large swings in production as the production of renewable energy ebbs and flows. Figure 2 shows the daily cycle the grid is forced to go through in California, where solar is the dominant source of renewable energy. During the day, solar production soars and conventional sources of power must greatly curtail production. As people get home from work, solar energy generation falls off just as demand starts to increase. A huge increase in conventional power generation is required to compensate for both the increase in demand and the decrease in solar generation.
FIGURE 2
While Texas produces a tremendous amount of renewable energy, very little of it is produced from solar. (Solar didn't even merit a entry in Table 2). The fact that Texas doesn't generate much solar energy doesn't keep Texas from experiencing a duck curve of its own. However, the duck curve in Texas is seen over months, not a single day. Table 3 contains ERCOT data for two days in 2020. (2) In the spring, when wind generation is high and electricity demand is relatively low, wind provides a huge fraction of Texas electricity; almost 40% on March 1. However, in the heat of the summer the situation is completely different. Electricity use soars by 69% while wind production plummets from the levels seen in the spring, down 57.4%!
TABLE 3
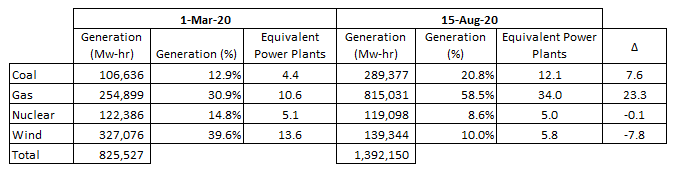
To add perspective to what the practical ramifications of all this are, the concept of an 'equivalent power plant' will be introduced. For the sake of discussion here, an equivalent power plant will be assigned a generation capacity of 1,000-megawatts (MW). So, in a 24-hour day, a single power plant of this size can produce 24,000-MW-hr of electricity. On this basis, Table 3 produces some staggering results. From the low-demand spring day to the high-demand summer day, the equivalent of almost 8-power plants worth of wind are shut-down! To counteract both the loss in wind generation and the huge increase in demand, the equivalent of almost 31-power plants worth of thermal power are forced to start-up.
The Electric Reliability Council of Texas, ERCOT, is responsible for ensuring an adequate and reliable supply of electricity in Texas. As the events of last week demonstrate, the system wasn't adequate or reliable, at least when asked to operate in an environment of record low temperatures. As more and more wind energy was added to the grid, the demands on the conventional sources of thermal power - coal and natural gas - became larger and larger even as the overall power provided by thermal power decreased! (From 2007 - 2020 coal as a source of electricity was cut in half while natural gas basically tread water) Stated another way, ERCOT asked thermal power sources to do more and more even as their ERCOT market share dropped lower and lower. It reminds me of a scene from a movie......"Thank you sir. May I have another?"
Peter Schmidt
Sugar Land, TX
February 28, 2021
PS - As always, if you like what you read, please register with the site. It just takes an e-mail address and I don't share this e-mail address with anyone. The more people who register with the site, the better case I can make to a publisher to press on with publishing my book. Registering with the site will give you access to the entire Confederacy of Dunces list as well as the financial crisis timeline.
Help spread the word to anyone you know who might be interested in the site or my Twitter account. I can be found on Twitter @The92ers
ENDNOTES:
1. The EIA is the US Energy Information Agency. They are a fantastic source of detail information on all types of energy and how it is produced.
https://www.eia.gov/electricity/annual/html/epa_03_01_a.html
2. ERCOT - Electric Reliability Council of Texas. ERCOT is the Independent System Operator (ISO) for Texas. They are charged with ensuring an adequate and reliable source of electricity in Texas. The data for the sources of electricity in Texas can be found in the 'Fuel Mix' reports on this page. The report are in Excel and easy to work with.
http://www.ercot.com/gridinfo/generation